
Posted by Emil Ahangarzadeh on 5/18/2016
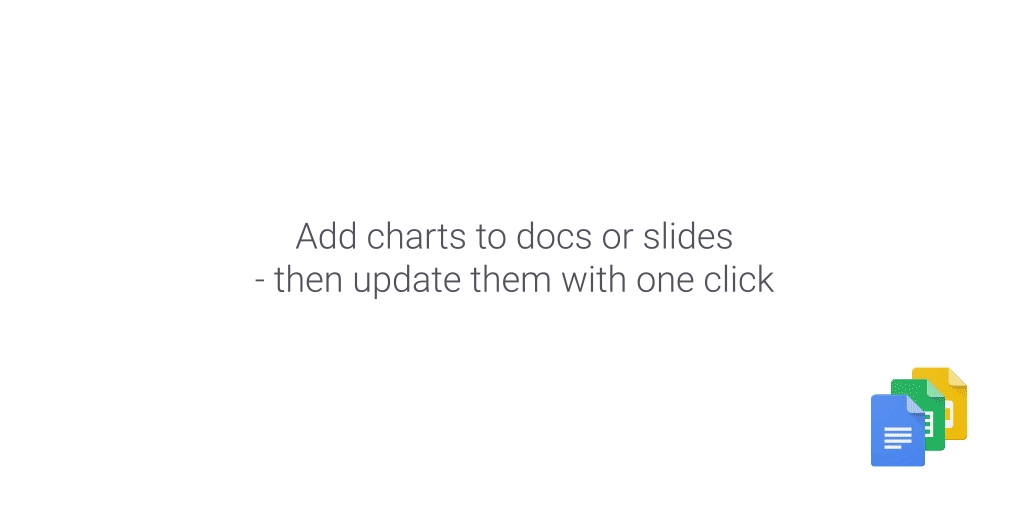
Charts help you display data in a visually compelling way. At work, the same chart may be used across multiple documents and presentations, to help you better convey your message and strengthen your argument. If that chart changes, it can be tedious and time-consuming to replace it in each and every file. To save you valuable time, Google now makes it possible to update your chart with a single click—without ever needing to leave your document or presentation.
To get started, simply go to Insert > Chart in Google Docs or Slides on the web. Insert a new chart, or select From Sheets to add an existing chart from the spreadsheet of your choice. As long as you check the Link to spreadsheet box, you’ll be given the option to update the chart with one click if its underlying data in Google Sheets changes. Should you no longer want to be notified of updates to a particular chart, you can simply unlink it. This same functionality is available if you copy and paste a chart into a document or presentation.
Please note that the ability to import or update linked charts will only be available to collaborators with edit access to the document, presentation, or underlying spreadsheet.